Monitoring
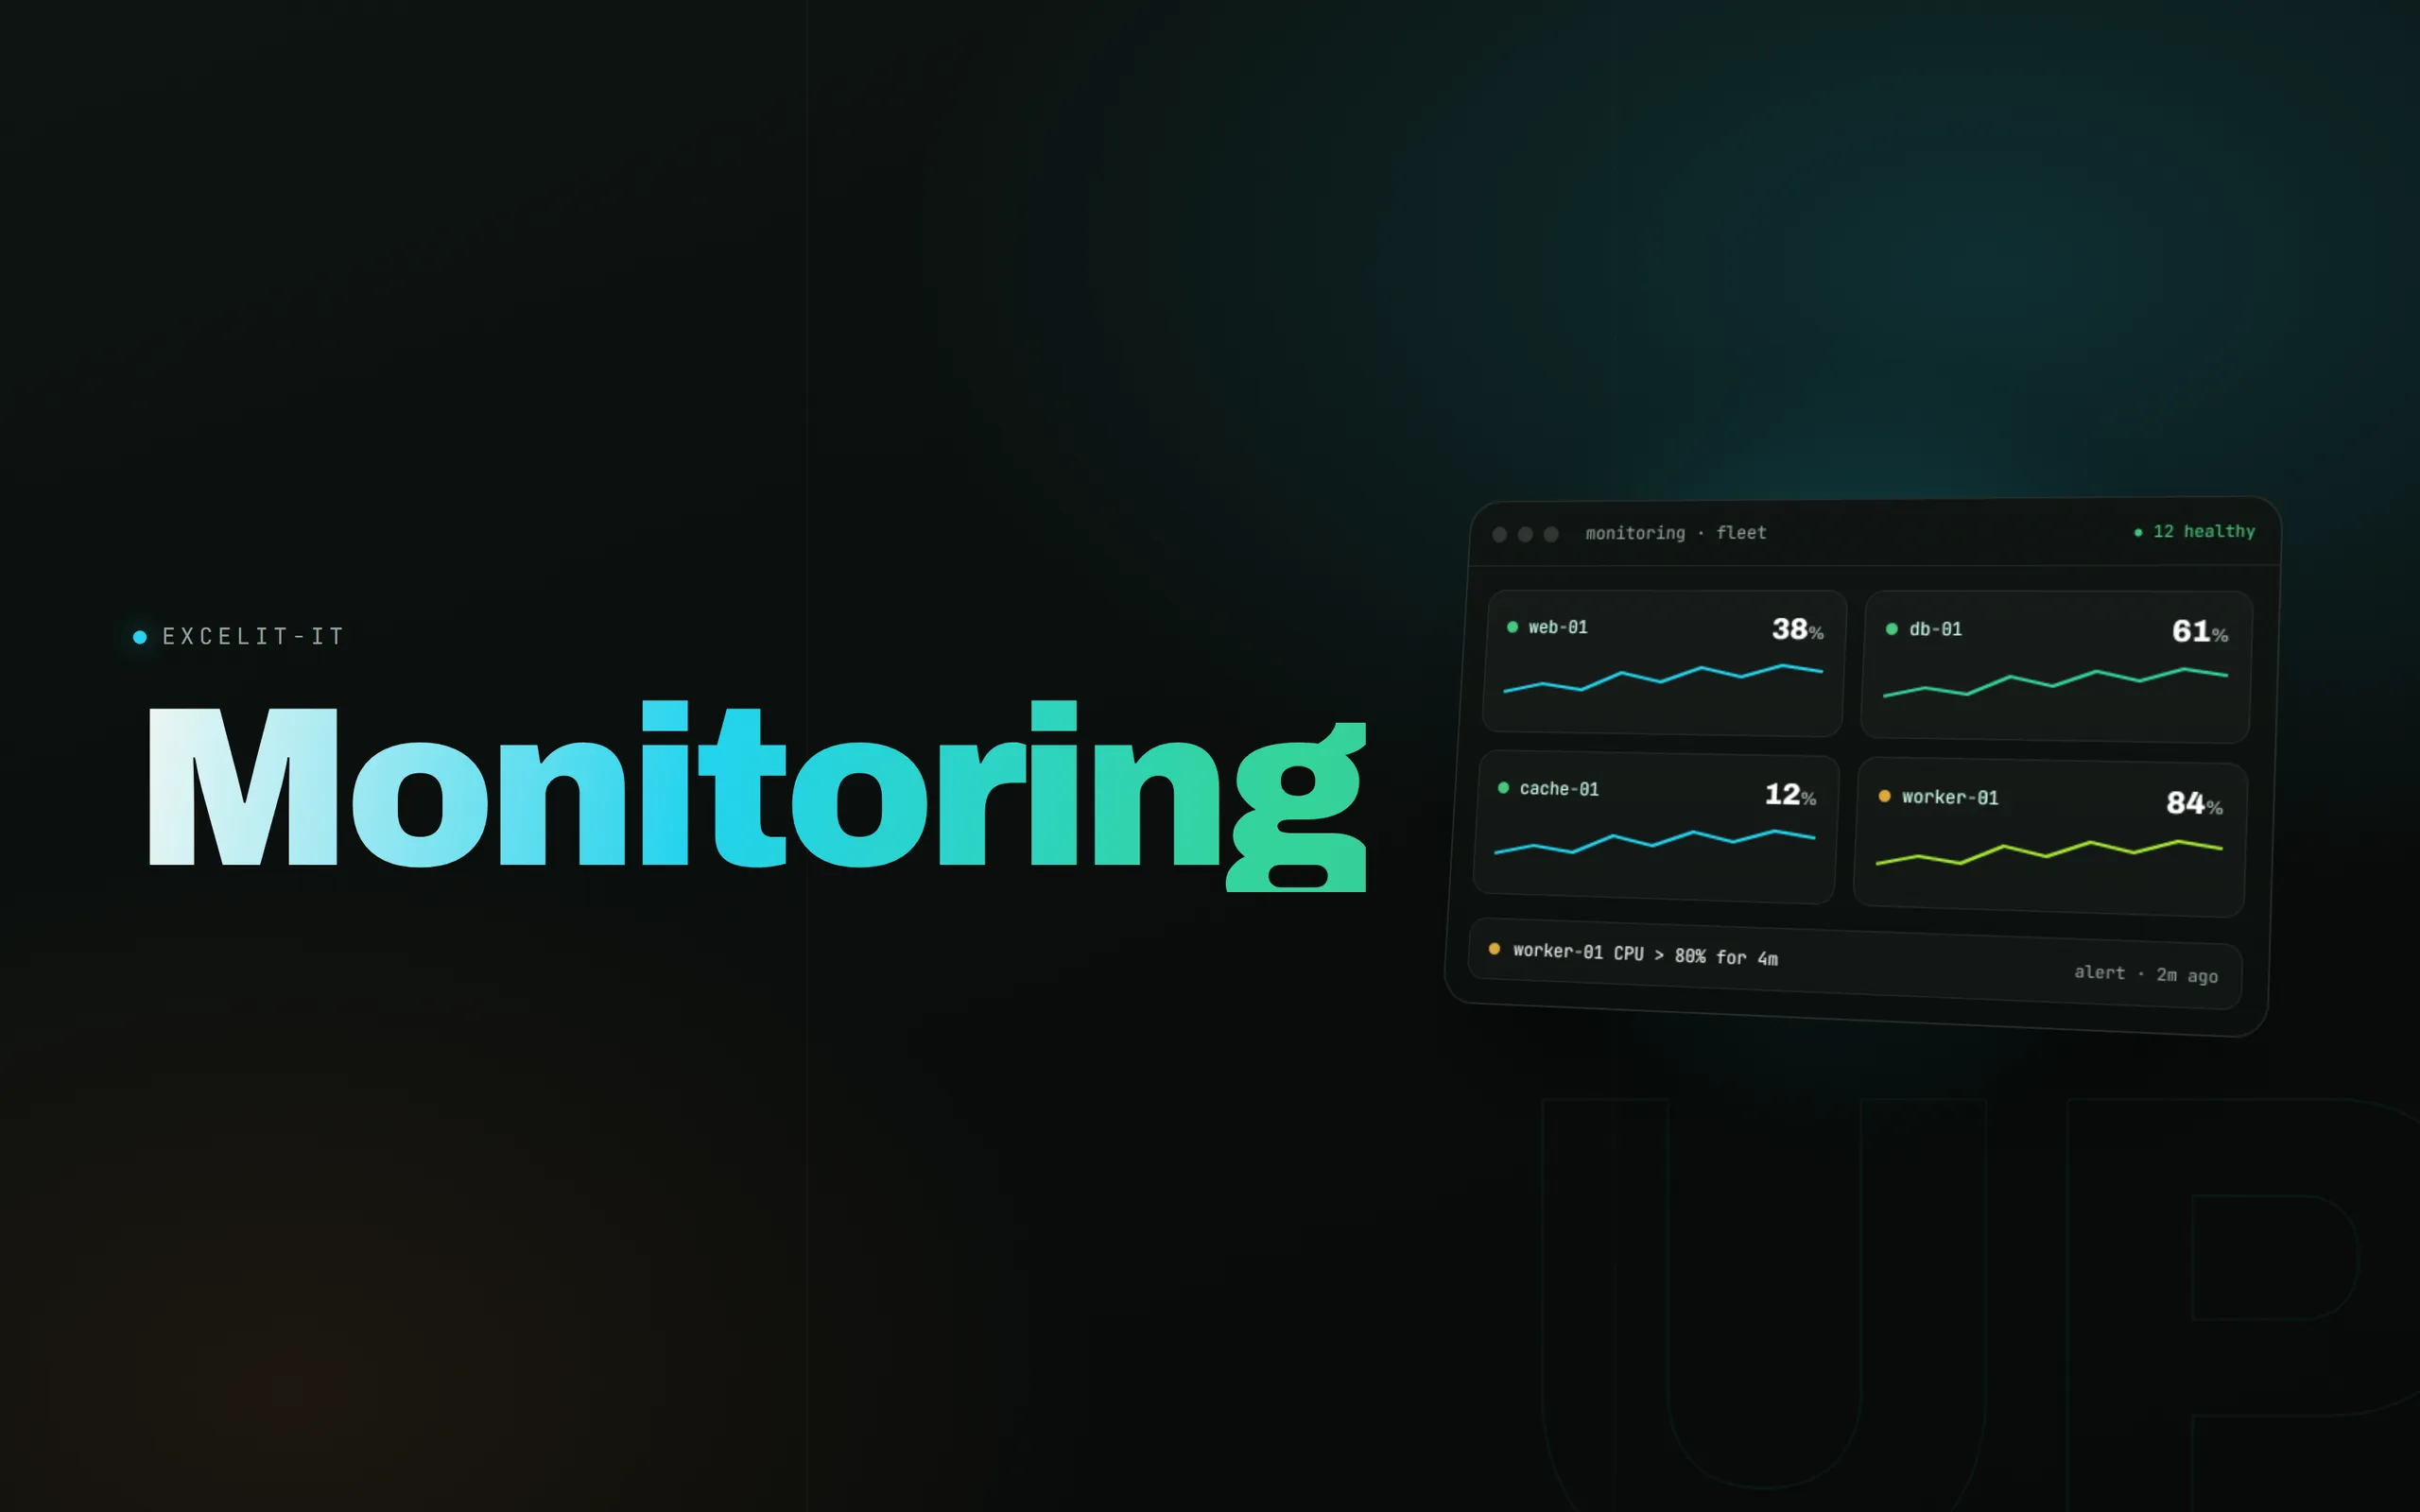
Real-time infrastructure & uptime monitoring — see everything, before it breaks. Live metrics, service health and alerting in one pane of glass.
01 /What it is
Monitoring is a single pane of glass for the servers and services your business depends on. Live metrics for CPU, memory, disk and network stream into per-host dashboards, while service checks, an incident timeline and alerting tell you the moment something drifts — not after your customers do. Historical graphs and roll-ups make capacity planning and post-incident review straightforward across your whole fleet.
02 /Features
• Live host metrics — CPU, memory, disk and network per host, in real time. • Service & uptime checks — Know the instant a service goes down. • Alerting & escalation — Threshold alerts routed to the right people. • Incident timeline — A clear record of what happened and when. • Historical graphs — Trends for capacity planning and reviews. • Multi-server fleet view — One dashboard across every server you run. • Agent-based collection — Lightweight agents on each host. • Health status board — At-a-glance green / amber / red.